Can You Walk to the World Cup? We Checked All 16 Stadiums So You Don’t Have To
As the 2026 FIFA World Cup draws closer, a surprisingly fierce debate has taken over social media: can fans actually reach the stadiums on foot?
Visitors from abroad, used to stadiums being part of the city, have been asking online how realistic walking really is during the World Cup. Even after being flooded with photos of highways and endless parking lots, many insisted they still planned to try anyway. Americans, including people involved with the tournament, responded with blunt warnings: “It’s illegal,” “you’re going to get hit,” and “plan on driving or calling an Uber instead.”
But are all 16 World Cup host cities really that unfriendly toward fans arriving without a car? To find out, we analyzed every stadium on the list and ranked them based on how safely and realistically supporters can get there on foot, by bike, or using public transportation.
Ranking the Most Walkable 2026 FIFA World Cup Host Cities
The rankings below offer a snapshot of which World Cup venues deliver the strongest car-free matchday experience, from rail access and walkability to broader bike connectivity around the stadium district.
| Rank | Stadium | City | Country | Walk Score (0-100) | Transit Score (0-100) | Bike Score (0-100) | Final Score |
|---|---|---|---|---|---|---|---|
| 1 | BC Place | Vancouver | Canada | 99 | 100 | 85 | 96.8 |
| 2 | Lumen Field | Seattle | USA | 89 | 100 | 92 | 86.1 |
| 3 | Mercedes-Benz Stadium | Atlanta | USA | 88 | 74 | 67 | 82.7 |
| 4 | BMO Field | Toronto | Canada | 82 | 96 | 75 | 76.6 |
| 5 | Estadio Azteca | Mexico City | Mexico | 60 | 65 | 30 | 62.5 |
| 6 | SoFi Stadium | Los Angeles (Inglewood) | USA | 67 | 52 | 55 | 58.4 |
| 7 | Levi’s Stadium | Santa Clara | USA | 42 | 48 | 55 | 53.1 |
| 8 | Lincoln Financial Field | Philadelphia | USA | 38 | 55 | 40 | 51.8 |
| 9 | NRG Stadium | Houston | USA | 30 | 40 | 35 | 44.2 |
| 10 | Estadio BBVA | Monterrey (Guadalupe) | Mexico | 35 | 30 | 20 | 43.1 |
| 11 | MetLife Stadium | East Rutherford | USA | 20 | 35 | 15 | 34.4 |
| 12 | AT&T Stadium | Arlington | USA | 46 | 10 | 40 | 29.8 |
| 13 | Gillette Stadium | Foxborough | USA | 17 | 10 | 20 | 28.9 |
| 14 | Estadio Akron | Guadalajara (Zapopan) | Mexico | 20 | 20 | 15 | 28.6 |
| 15 | Hard Rock Stadium | Miami Gardens | USA | 25 | 25 | 30 | 20.0 |
| 16 | Arrowhead Stadium | Kansas City | USA | 24 | 15 | 20 | 12.8 |
Key Findings
- Dallas, Miami, Kansas City, and Guadalajara have no rail service within walking distance (1.5 km)
- A third of World Cup venues have fewer than three hotels within a 1 km radius.
- The average bottom-five World Cup stadium is located 25 km from the nearest major airport or downtown core.
- Vancouver Stadium has 20 times more restaurants and bars within 1 km than Kansas City Stadium.
- Vancouver and Seattle were the only venues to earn perfect Transit Scores of 100.
Top 5 Most Walkable 2026 World Cup Host Cities
For all the criticism aimed at North America’s car culture ahead of the 2026 World Cup, several host cities are far more navigable than expected. Canada leads the way with both host venues inside the top five, while Seattle and Atlanta have doubled down on cycling, rail, and pedestrian access. In Mexico City, matchday crowds may barely feel different from the movement of everyday life.
Vancouver
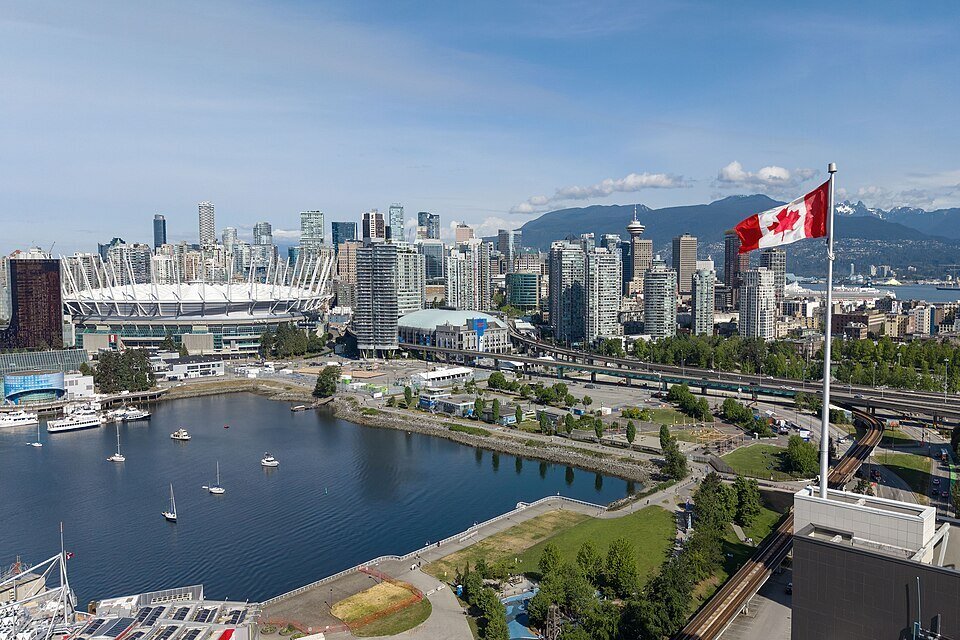
Vancouver may be the ultimate World Cup host city for people who care about walkability. The stadium, BC Place, is right in downtown, surrounded by dense neighborhoods, transit connections, restaurants, bars, and pedestrian-friendly streets. Fans have more than 120 hotels to choose from within a 2-kilometer radius, alongside over 100 restaurants and bars packed into the surrounding area (less than a kilometer away).
And with huge crowds expected, organizers are making the trip to the match part of the experience. A designated “Last Mile” route will begin at Main Street–Science World Station, guiding supporters through a festival-style waterfront corridor packed with live music, entertainment, food vendors, merchandise stands, and pre-match activations before they reach BC Place.
Seattle

After voters approved $133.5 million for bike infrastructure in 2024, Seattle moved ahead with major upgrades, including protected lane work around Occidental Avenue near Seattle Stadium. Merely two years later, the city leads all World Cup host cities for cycling access and owns the tournament’s second-highest walk score. The ground’s location is a big part of the appeal, too. Seattle Stadium is wedged right beside downtown, with Pioneer Square, the waterfront, Pike Place Market, and major transit connections all clustered around the venue.
Atlanta
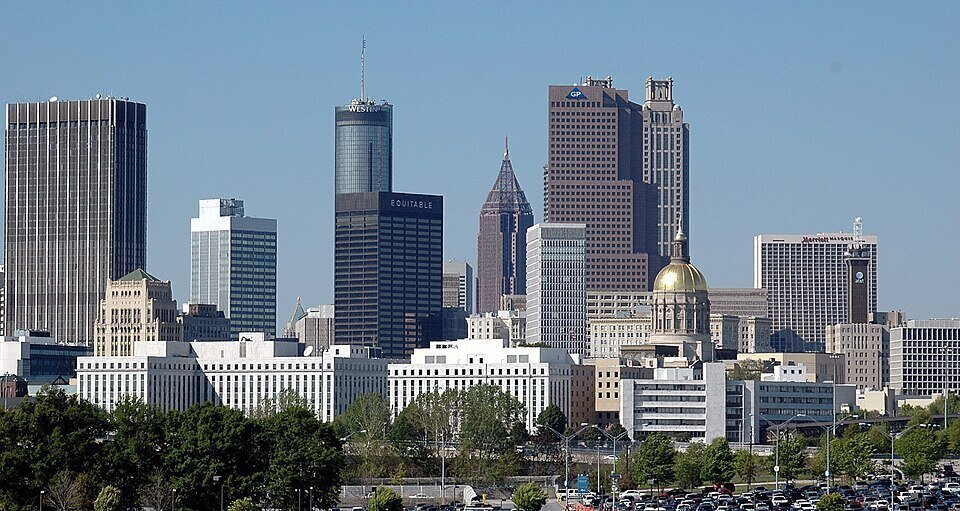
Walkability is not usually associated with Atlanta, a city shaped by highways and suburban sprawl. But the Mercedes-Benz Stadium district works very differently. The venue rises beside Centennial Olympic Park, State Farm Arena, and the Georgia World Congress Center on the western edge of downtown. GWCC/CNN Center Station is only steps away, while MARTA trains connect directly to Hartsfield-Jackson Airport.
Organizers are also planning major road closures around the stadium during matches, effectively turning large chunks of downtown into pedestrian-first corridors connected to rail stations, hotels, and BeltLine-linked bike routes.
Toronto

Toronto’s stadium district is highly walkable once you reach Exhibition Place. However, the Gardiner Expressway cuts the stadium district off from large parts of downtown, making the approach longer and more awkward than cities like Vancouver or Seattle. Fans moving from the financial core are funneled through bridges, underpasses, and specific pedestrian corridors rather than a continuous street grid.
At the same time, Toronto scores stronger for cycling than Atlanta. BMO Field connects directly to the 35-mile Martin Goodman Trail, a waterfront route that stretches across much of the city, along with dedicated bike corridors, Bike Share Toronto stations, and extensive lakefront paths that feed straight into the stadium zone. The closest restaurant cluster is Liberty Village, immediately northeast of the stadium and roughly a 10 to 15 minute walk away.
Mexico City

Few World Cup stadiums are woven into the fabric of a megacity quite like Estadio Azteca. You could technically walk there from the main tourist zones around Reforma or the historic center without running into illegal highway crossings or dead suburban wastelands. Of course, there is a catch, and in this case, it’s a roughly four-hour altitude workout at 2,240 meters above sea level.
Most fans will probably take the transit options instead. Mexico City also did not need major World Cup mobility prep because walking and public transportation are already part of daily life for millions. Tren Ligero light rail stops directly at Estadio Azteca station, only a five-minute walk from the venue, while Metro Line 2 connects fans from downtown for 80 pesos total.
You might even want to hop off a stop or two early just to soak in the matchday buildup. The streets around Azteca (and all of Mexico City, for that matter) are expected to be packed with tacos al pastor stands, vendors selling jerseys and scarves, smoke from grills, chants, drums, and the full chaotic atmosphere Mexicans are famous for.
Why Guadalajara, Miami, and Kansas City Rank at the Bottom
Guadalajara, Miami, and Kansas City ranked at the bottom largely because their stadiums were built around car access, with weak transit links and poor pedestrian connectivity. Temporary event transport solutions are compensating for infrastructure that was never designed for dense international crowds.
Miami and Kansas City face some of the tournament’s toughest transit questions. Hard Rock Stadium lies well outside Miami’s main rail network, without direct Metrorail or Tri-Rail access nearby, while Kansas City Stadium remains completely disconnected from the KC Streetcar system. Both venues are surrounded more by sprawling parking lots than pedestrian infrastructure, a setup that works well for NFL tailgating, even if the overall World Cup environment may not fully lend itself to that atmosphere. It also leaves organizers heavily reliant on special event transportation operations.
Guadalajara’s setup is different, but still limiting. Estadio Akron relies on BRT access through Mi Macro Periférico and the Andador Chivas pedestrian corridor, though the venue lies roughly 15 to 20 kilometers outside central Guadalajara in a suburban, car-oriented area. It also ranks among the tournament’s weakest surrounding hospitality zones, featuring just three hotels within two kilometers, tied alongside Kansas City for the lowest total. For cyclists, the score matches New York New Jersey Stadium as the worst in the field.
Will Bad Commutes Scare Off World Cup Visitors from Walking?
The walk to a 2026 World Cup match will certainly not feel the same across every host city. In some cases, including walk around and to MetLife Stadium (New York New Jersey Stadium) ahead of the grand final, is either heavily restricted or outright illegal. Not to mention the danger factor tied to high-speed interstates and highways without pedestrian sidewalks. YouTuber Evan Edinger explores the issue extensively in the following video:
A Reddit thread about walking to Hard Rock Stadium during the Miami GP warned that many hotels are “4 to 7 miles away,” adding that “Miami in May is brutal with the humidity” and that being near overpasses can feel “sketchy” because of heavy traffic and limited sidewalks.
Over on Instagram, several reels mocking U.S. World Cup infrastructure joked about international supporters expecting walkable stadium approaches only to run into giant highways, endless parking lots, and missing sidewalks.
Methodology
Each 2026 World Cup stadium received a composite accessibility score from 0 to 100 based on six weighted categories tied to walkability, transit access, surrounding infrastructure, and overall urban integration.
| Category | Weight | Primary Sources | What It Measures |
|---|---|---|---|
| Walk Score | 25% | walkscore.com, estimated for Mexican venues | Overall pedestrian accessibility, nearby amenities, and route quality |
| Transit Score | 20% | walkscore.com, estimated for Mexican venues | Public transportation accessibility around the venue |
| Transit Connectivity | 20% | Google Maps, transit authority websites | Rail proximity, station density, and transit quality |
| Surrounding Amenities | 15% | Google Maps estimates | Nearby hotels, restaurants, and dining access |
| Urban Context | 10% | Google Maps, satellite review | City integration, parking dominance, and highway barriers |
| Pedestrian Infrastructure | 10% | Street View, transit guides | Sidewalks, pedestrian corridors, bridges, shade, and weather protection |
Such metrics then underwent min-max normalization across all 16 host venues before category allocations combined to produce the final scores and rankings.
For distance-based variables, including distance to rail stations and city center proximity, lower distances received higher scores through inverse scaling.
Several categorical variables were converted into fixed values:
- Setting type: Urban core = 100, Urban edge = 60, Suburban = 20, Exurban = 0
- Parking dominance: No = 100, Partial = 50, Yes = 0
- Sidewalk coverage: Full = 100, Partial = 50, None = 0
- Rail type:
- Metro / heavy rail = 100
- Light rail = 80
- Commuter rail = 60
- BRT = 40
- Event-only rail = 30
- None = 0
Categories containing multiple variables used the following internal weighting breakdown.
| Category | Internal Weighting |
|---|---|
| Transit Connectivity | Distance to rail 40% – Station count 30% – Rail quality 30% |
| Surrounding Amenities | Hotels 35% – Restaurants 35% – Dining cluster distance 30% |
| Urban Context | City-center distance 35% – Setting type 25% – Parking dominance 20% – Highway barriers 20% |
| Pedestrian Infrastructure | Dedicated routes 35% – Sidewalk coverage 35% – Bridges/underpasses 15% – Shade/weather protection 15% |
Caveats
Walk Score and Transit Score values for the three Mexican venues — Azteca Stadium, BBVA Stadium, and Akron Stadium — are estimated because walkscore.com does not consistently support addresses outside the United States and Canada. We instead relied on official transit maps, municipal mobility plans, and supplementary urban accessibility research.
Hotel and restaurant totals are approximate counts based on Google Maps rather than direct API extraction.
All data was collected in May 2026.
Sources
- walkscore.com
- Google Maps
- FIFA.com
- Official stadium and transit authority websites
- David William Rosales transit guide
- Action Network fan experience study
Summary
Our analysis of all 16 host venues for the 2026 FIFA World Cup found major differences in how easily fans can reach stadiums without a car. Vancouver, Seattle, Atlanta, Toronto, and Mexico City ranked highest for walkability, transit, and cycling access, while Miami, Kansas City, and Guadalajara placed near the bottom because of weak rail links and car-oriented stadium layouts.
Several host cities are planning expanded shuttle operations and pedestrian corridors, though questions remain around pricing and how effectively those systems will handle peak matchday demand. We advise fans to follow official updates closer to kickoff, as mobility plans and access routes may still change before the tournament begins.