
Which U.S. States Are the Most Charitable?
Americans are generous, but not equally so. While billions in charitable donations are spent each year, some states give far more than others. Cultural values, income levels, and community traditions all play a role. To get a clearer picture of the most charitable states in the US, we analyzed the latest IRS and Census data, ranking all 50 states by per capita giving, share of income donated, and total dollars contributed.
Key Findings
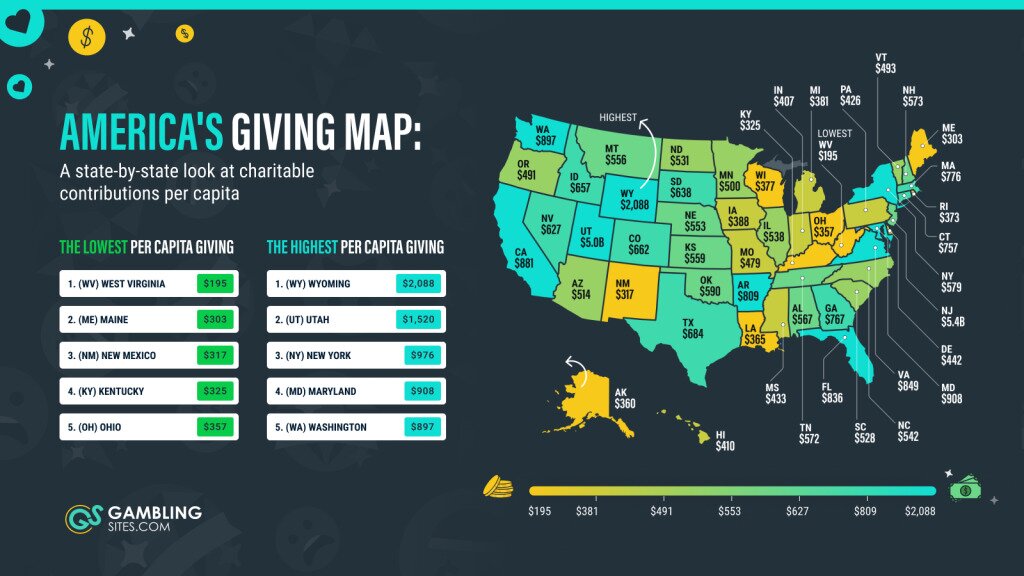
- Wyoming gives the most per person: The nation’s smallest state in population tops the charts in generosity. Residents donate an average of $2,088 per capita, more than double the U.S. average.
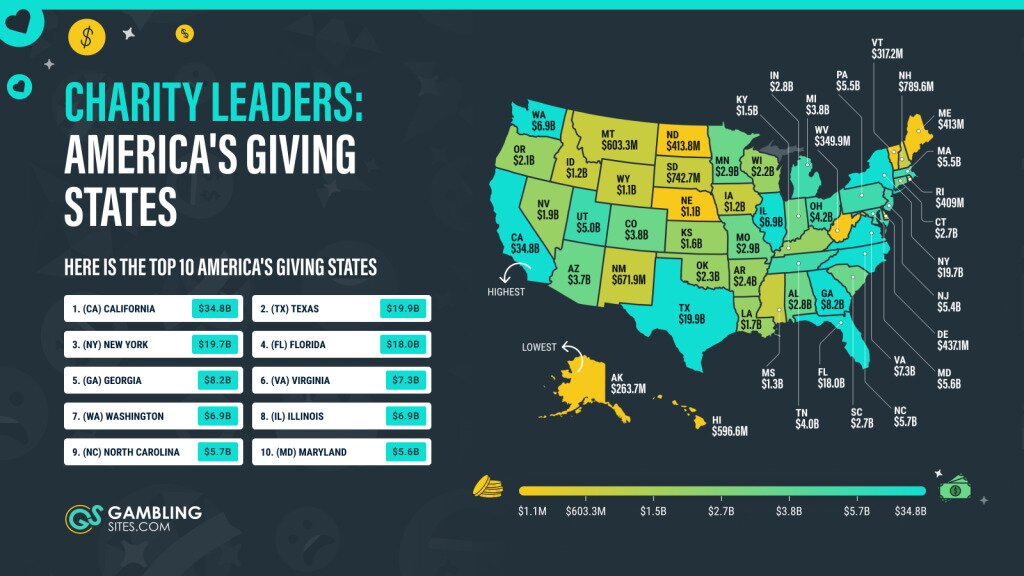
- California leads in total dollars: Living up to its “Golden State” reputation, Californians donated an impressive $34.8 billion, beating Texas ($27.3B) and New York ($21.1B).
- Arkansas donates the highest share of income: Despite lower average incomes, Arkansas donates the largest share of their earnings. Residents give 2.54% of their Adjusted Gross Income (AGI) to charity, just ahead of Utah (2.42%).
What are America’s Most Charitable States?
Our map breaks down charitable giving across all 50 states, pulling back the curtain on how generosity really varies nationwide. Who’s truly generous? And who’s a tad more stingy? The results may surprise you. To give our key findings a bit more context, we’ve analyzed the socioeconomic and cultural trends that shape these states’ approach to the act of giving.
The U.S. Charitable Giving Map: Who’s Leading the Way?
Wyoming: The Nation’s Most Generous State Per Person
That’s right. Wyoming, the state with just over half a million residents, which is roughly the size of a single neighborhood in New York City, is the most generous state per person. Wyomingites contribute $2,088 per capita, per year, towards charitable causes, which comes out at around 3.94% of income. This is the highest in the whole country.
With the highest per capita giving in the nation, Wyoming proves that generosity can thrive even in the country’s most sparsely populated places. Wyoming’s position at the top of the rankings reflects a unique mix of conditions: its favourable tax environment, substantial contributions from high-net-worth individuals and a strong culture of community support traditions. Together, these factors help explain why Wyoming residents give at levels far beyond what their population size would suggest.
Which States Donate the Most Per Person?
California: America’s Giving Powerhouse
With the largest population and economy, California dominates in raw dollars. To put that into perspective California has more people than the whole of Canada. Converted into numbers the state is verging on nearly 40,000,000 people, and that’s not including its 300 or so ghost towns! As a result, a total of $34.8 billion pours out of the state towards philanthropic activities every year, or around $880 per person.
The state’s deep pockets are matched by its deep networks of philanthropy, fueled by major corporate donors and a thriving nonprofit ecosystem. You’ve got globally recognized hubs like Silicon Valley oozing with tech wealth; the Silicon Valley Community Foundation (SVCF) connects this wealth to both local and global causes. This is just one out of a whole network of foundations that are turning the state’s economic success into lasting social impact.
Arkansas: Income Share Leaders
Arkansas may not be the wealthiest state, but it consistently ranks among America’s most charitable states. Residents donate about 2.54% of their AGI to charity (one of the highest shares nationwide) totaling roughly $809 per person. If we take the low cost of living into account it’s clear that Arkansans prioritize giving as a core value, not just a luxury.
The generosity in Arkansas is grounded in everyday community life. Church based tithing, neighborhood fundraisers, and local charities all play a central role in how Arkansans give. Even the state’s famous Crater of Diamonds Park mirrors that participatory spirit, offering the public a rare chance to dig for and keep any gems they find.
New England’s Surprising Low Generosity
Now this may come as one of the most surprising listings. Even though New England is home to some of the wealthiest states, it seriously lags when it comes to donations. Its states barely reach the 1% mark in income donations, Rhode Island is at 0.85%, Maine at 0.84%, New Hampshire at 0.83%, Massachusetts at 0.82%, and Vermont at an underwhelming 0.77%.
So. What gives? Well, for a start, New England is one of the least religious regions in the U.S. That could say a lot about the level of its generosity. States with fewer churchgoers tend to report lower charitable giving overall. Also, in some New England states, there’s probably a stronger government safety net than in some more rural areas meaning that the need to donate to charity isn’t as great. It’s also somewhat understood that New Englanders often view giving as a personal responsibility and not a public gesture, so people are still giving but on a more informal basis.
Methodology
To uncover how generosity varies across the United States, we analyzed the latest available IRS and U.S. Census data to rank all 50 states on charitable giving. Our data was gathered from:
Each state’s rank was determined using four key metrics:
- Total dollars donated – the total charitable contributions reported by taxpayers.
- Share of income donated (% of AGI) – the percentage of adjusted gross income directed to charity.
- Per capita giving – average giving per resident, adjusted for population size.
- Share of taxpayers donating – proportion of filers reporting charitable contributions.
Political affiliation (“red” vs. “blue” states) was based on the 2024 U.S. presidential election results, allowing us to compare giving patterns along political lines.
Where relevant, contextual insights (such as cost of living, cultural factors, and community trends) were added to interpret the numbers beyond face value.
Data Table: U.S Charitable Giving by State
| State | Total Charitable Contributions | Number of Returns W/ Charitable Contributions | Total Returns Filed | Adjusted Gross Income | Total Population (2020 Census) | Charitable Amount Per Capita | Charitable Percent of Income | Charitable Returns |
|---|---|---|---|---|---|---|---|---|
| Alabama | $2,846,486,000 | 138,170 | 2,149,560 | $159,215,844,000 | 5,024,279 | $567 | 1.79% | 6.43% |
| Alaska | $263,663,000 | 14,210 | 348,250 | $30,289,519,000 | 733,391 | $360 | 0.87% | 4.08% |
| Arizona | $3,677,021,000 | 241,020 | 3,373,850 | $287,127,454,000 | 7,151,502 | $514 | 1.28% | 7.14% |
| Arkansas | $2,436,751,000 | 62,770 | 1,295,860 | $95,807,833,000 | 3,011,524 | $809 | 2.54% | 4.84% |
| California | $34,813,548,000 | 2,287,850 | 18,487,690 | $1,987,000,701,000 | 39,538,223 | $881 | 1.75% | 12.37% |
| Colorado | $3,819,827,000 | 256,140 | 2,972,380 | $297,676,269,000 | 5,773,714 | $662 | 1.28% | 8.62% |
| Connecticut | $2,728,564,000 | 164,700 | 1,823,240 | $217,323,692,000 | 3,605,944 | $757 | 1.26% | 9.03% |
| Delaware | $437,139,000 | 37,690 | 503,140 | $42,387,377,000 | 989,948 | $442 | 1.03% | 7.49% |
| Florida | $17,995,793,000 | 686,200 | 11,130,320 | $1,121,782,194,000 | 21,538,187 | $836 | 1.60% | 6.17% |
| Georgia | $8,218,684,000 | 480,120 | 4,932,040 | $405,672,589,000 | 10,711,908 | $767 | 2.03% | 9.73% |
| Hawaii | $596,568,000 | 59,620 | 689,960 | $57,676,242,000 | 1,455,271 | $410 | 1.03% | 8.64% |
| Idaho | $1,208,840,000 | 59,390 | 869,500 | $72,860,958,000 | 1,839,106 | $657 | 1.66% | 6.83% |
| Illinois | $6,887,664,000 | 420,260 | 6,112,890 | $580,846,466,000 | 12,812,508 | $538 | 1.19% | 6.87% |
| Indiana | $2,762,591,000 | 136,820 | 3,246,780 | $246,316,586,000 | 6,785,528 | $407 | 1.12% | 4.21% |
| Iowa | $1,237,692,000 | 73,520 | 1,485,900 | $122,342,275,000 | 3,190,369 | $388 | 1.01% | 4.95% |
| Kansas | $1,642,849,000 | 73,550 | 1,361,370 | $112,582,214,000 | 2,937,880 | $559 | 1.46% | 5.40% |
| Kentucky | $1,463,023,000 | 86,190 | 1,975,890 | $139,288,462,000 | 4,505,836 | $325 | 1.05% | 4.36% |
| Louisiana | $1,700,364,000 | 99,250 | 1,970,500 | $140,655,941,000 | 4,657,757 | $365 | 1.21% | 5.04% |
| Maine | $413,025,000 | 29,010 | 710,860 | $54,409,847,000 | 1,362,359 | $303 | 0.76% | 4.08% |
| Maryland | $5,607,656,000 | 507,940 | 3,095,140 | $295,351,996,000 | 6,177,224 | $908 | 1.90% | 16.41% |
| Massachusetts | $5,456,242,000 | 329,950 | 3,567,790 | $422,208,182,000 | 7,029,917 | $776 | 1.29% | 9.25% |
| Michigan | $3,835,713,000 | 228,840 | 4,871,390 | $379,740,366,000 | 10,077,331 | $381 | 1.01% | 4.70% |
| Minnesota | $2,856,028,000 | 199,730 | 2,871,840 | $264,184,944,000 | 5,706,494 | $500 | 1.08% | 6.95% |
| Mississippi | $1,281,290,000 | 69,790 | 1,245,240 | $78,974,586,000 | 2,961,279 | $433 | 1.62% | 5.60% |
| Missouri | $2,947,292,000 | 143,720 | 2,880,050 | $225,671,354,000 | 6,154,913 | $479 | 1.31% | 4.99% |
| Montana | $603,275,000 | 33,850 | 550,380 | $47,309,400,000 | 1,084,225 | $556 | 1.28% | 6.15% |
| Nebraska | $1,085,442,000 | 46,920 | 940,690 | $79,864,152,000 | 1,961,504 | $553 | 1.36% | 4.99% |
| Nevada | $1,946,441,000 | 102,050 | 1,553,270 | $145,994,535,000 | 3,104,614 | $627 | 1.33% | 6.57% |
| New Hampshire | $789,629,000 | 40,620 | 731,910 | $76,794,934,000 | 1,377,529 | $573 | 1.03% | 5.55% |
| New Jersey | $5,379,532,000 | 504,310 | 4,638,510 | $504,015,160,000 | 9,288,994 | $579 | 1.07% | 10.87% |
| New Mexico | $671,853,000 | 43,690 | 987,790 | $64,857,077,000 | 2,117,522 | $317 | 1.04% | 4.42% |
| New York | $19,713,530,000 | 812,690 | 9,767,160 | $1,018,899,559,000 | 20,201,249 | $976 | 1.93% | 8.32% |
| North Carolina | $5,654,161,000 | 331,130 | 4,943,390 | $412,484,508,000 | 10,439,388 | $542 | 1.37% | 6.70% |
| North Dakota | $413,809,000 | 12,790 | 368,090 | $33,720,657,000 | 779,094 | $531 | 1.23% | 3.47% |
| Ohio | $4,214,980,000 | 229,550 | 5,692,070 | $438,525,537,000 | 11,799,448 | $357 | 0.96% | 4.03% |
| Oklahoma | $2,337,321,000 | 90,950 | 1,713,370 | $125,419,368,000 | 3,959,353 | $590 | 1.86% | 5.31% |
| Oregon | $2,078,943,000 | 184,080 | 2,030,990 | $174,318,031,000 | 4,237,256 | $491 | 1.19% | 9.06% |
| Pennsylvania | $5,534,036,000 | 346,380 | 6,325,490 | $549,715,592,000 | 13,002,700 | $426 | 1.01% | 5.48% |
| Rhode Island | $408,991,000 | 34,760 | 568,360 | $47,930,497,000 | 1,097,379 | $373 | 0.85% | 6.12% |
| South Carolina | $2,701,055,000 | 156,660 | 2,481,150 | $191,369,595,000 | 5,118,425 | $528 | 1.41% | 6.31% |
| South Dakota | $742,696,000 | 15,860 | 441,520 | $38,863,829,000 | 886,667 | $838 | 1.91% | 3.59% |
| Tennessee | $3,952,542,000 | 159,300 | 3,247,910 | $267,534,018,000 | 6,910,840 | $572 | 1.48% | 4.90% |
| Texas | $19,947,783,000 | 856,470 | 13,641,000 | $1,252,113,837,000 | 29,145,505 | $684 | 1.59% | 6.28% |
| Utah | $4,973,431,000 | 180,060 | 1,514,460 | $141,245,443,000 | 3,271,616 | $1,520 | 3.52% | 11.89% |
| Vermont | $317,186,000 | 14,010 | 336,880 | $27,149,664,000 | 643,077 | $493 | 1.17% | 4.16% |
| Virginia | $7,330,826,000 | 453,160 | 4,160,340 | $410,639,684,000 | 8,631,393 | $849 | 1.79% | 10.89% |
| Washington | $6,910,218,000 | 321,280 | 3,757,410 | $416,412,736,000 | 7,705,281 | $897 | 1.66% | 8.55% |
| West Virginia | $349,905,000 | 19,860 | 776,010 | $50,488,126,000 | 1,793,716 | $195 | 0.69% | 2.56% |
| Wisconsin | $2,224,197,000 | 134,890 | 2,940,980 | $245,188,540,000 | 5,893,718 | $377 | 0.91% | 4.59% |
| Wyoming | $1,204,266,000 | 11,630 | 280,750 | $30,549,840,000 | 576,851 | $2,088 | 3.94% | 4.14% |
Generosity Reveals America’s true Spirit
In a moment when inflation, wage pressures, and uncertainty loom large, America’s generosity becomes a telling mirror of its values. Yes, states like California pour billions into philanthropy, but the real story is how giving adapts under strain. Some states maintain high giving even when incomes stagnate; others fall behind. Our rankings make one thing clear: generosity isn’t a luxury reserved for boom times, it’s part of the national fabric. In that sense, generosity becomes as much about character as capacity, and we think that’s a story worth telling.
How Do People Give?
Beyond checks and online donations lies a subtler (and often overlooked) channel: charitable gambling — state lotteries, raffle draws, sweepstakes, bingo and even poker tournaments. In many states, it’s the only form of gambling allowed. While in others, it supports a healthy regulated system. It’s big in charitable states like California, Virginia, and Michigan, for example. Lottery proceeds from charitable gambling fund public education, veterans’ programs, parks, and community grants. So, when someone buys a lottery ticket, they’re not just after a jackpot, they’re, in some measure, giving back.
And yet, while our main rankings spotlight direct giving, these gambling contributions represent another vein of giving that often runs parallel to traditional philanthropy. Together, they compose a more complete map of how Americans support their communities.